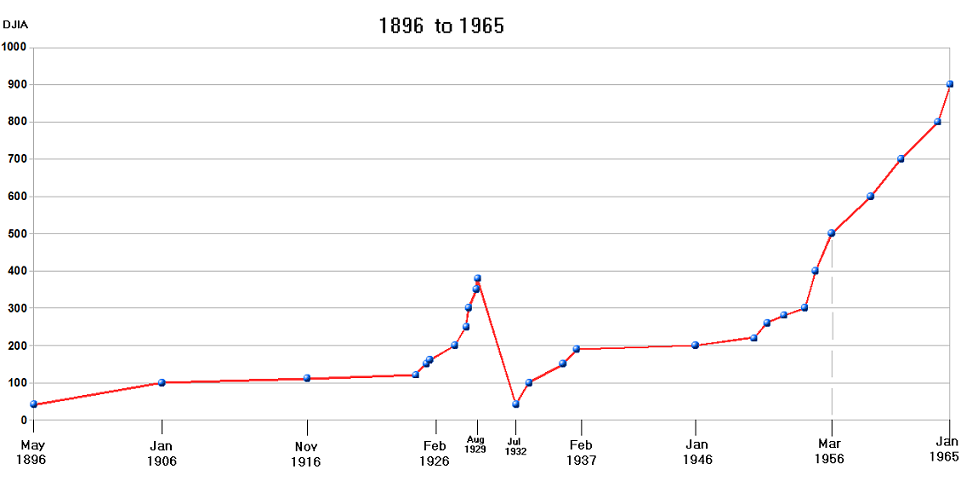
GRAPH 1

| ***************** | ******** |
***************** | ******** |
***************** | ******** |
***************** | ******** |
***************** | ******** |
***************** | ******** |
| 05/26/1896 | 41 |
02/04/1926 | 160 |
08/30/1929 | 380 |
02/11/1937 | 190 |
08/11/1952 | 280 |
02/20/1959 | 600 |
| 01/12/1906 | 100 |
12/19/1927 | 200 |
07/11/1932 | 42 |
01/11/1946 | 200 |
03/11/1954 | 300 |
05/17/1961 | 700 |
| 11/18/1916 | 110 |
10/17/1928 | 250 |
07/03/1933 | 100 |
05/17/1950 | 220 |
12/29/1954 | 400 |
02/28/1964 | 800 |
| 12/31/1924 | 120 |
12/31/1928 | 300 |
02/04/1936 | 150 |
05/01/1951 | 260 |
03/12/1956 | 500 |
01/28/1965 | 900 |
| 10/20/1925 | 150 |
08/01/1929 | 350 |
The above graph (and table) show the major changes in the Dow Jones Industrial Average from 1896 to 1965. Most of the changes shown are increases except for the infamous "crash" which went from a "high" of 381.17 on September 03, 1929 to a "low" of 41.22 on July 08, 1932.
GRAPH 2

| ***************** | ************ |
***************** | ************ |
***************** | ************ |
***************** | ************ |
| 11/14/1972 | 1,000 |
02/23/1995 | 4,000 |
02/13/1997 | 7,000 |
03/29/1999 | 10,000 |
| 12/11/1985 | 1,500 |
06/16/1995 | 4,500 |
06/10/1997 | 7,500 |
05/03/1999 | 11,000 |
| 01/08/1987 | 2,000 |
11/21/1995 | 5,000 |
07/16/1997 | 8,000 |
10/19/2006 | 12,000 |
| 07/17/1987 | 2,500 |
02/08/1996 | 5,500 |
02/27/1998 | 8,500 |
04/25/2007 | 13,000 |
| 04/17/1991 | 3,000 |
10/14/1996 | 6,000 |
04/06/1998 | 9,000 |
07/19/2007 | 14,000 |
| 05/19/1993 | 3,500 |
11/25/1996 | 6,500 |
01/06/1999 | 9,500 |
*** | *** |
This graph (and table) show the major increases of the Dow Jones Industrial Average from 1965 to 2009.
It is interesting to note that the "Dow" took seven and a half years to go from 900 to 1,000.
|
GRAPH 3
2010 - Present

| 05/07/2013 | 15,000 |
10/18/2017 | 23,000 |
01/07/2021 | 31,000 |
| 11/21/2013 | 16,000 |
11/30/2017 | 24,000 |
03/10/2021 | 32,000 |
| 07/03/2014 | 17,000 |
01/04/2018 | 25,000 |
03/17/2021 | 33,000 |
| 12/23/2014 | 18,000 |
01/17/2018 | 26,000 |
04/15/2021 | 34,000 |
| 11/22/2016 | 19,000 |
07/11/2019 | 27,000 |
07/23/2021 | 35,000 |
| 01/25/2017 | 20,000 |
11/15/2019 | 28,000 |
11/02/2021 | 36,000 |
| 03/01/2017 | 21,000 |
01/15/2020 | 29,000 |
***** | 37,000 |
| 08/02/2017 | 22,000 |
11/24/2020 | 30,000 |
***** | 38,000 |
The Dow broke the "20,000" mark on January 25, 2017.
The Dow broke the "25,000" mark on January 04, 2018.
The Dow broke the "30,000" mark on November 24, 2020.
The Dow broke the "35,000" mark on July 23, 2021.
Return To Home Page
Copyright © 1999 -
1728 Software Systems
|
|
|